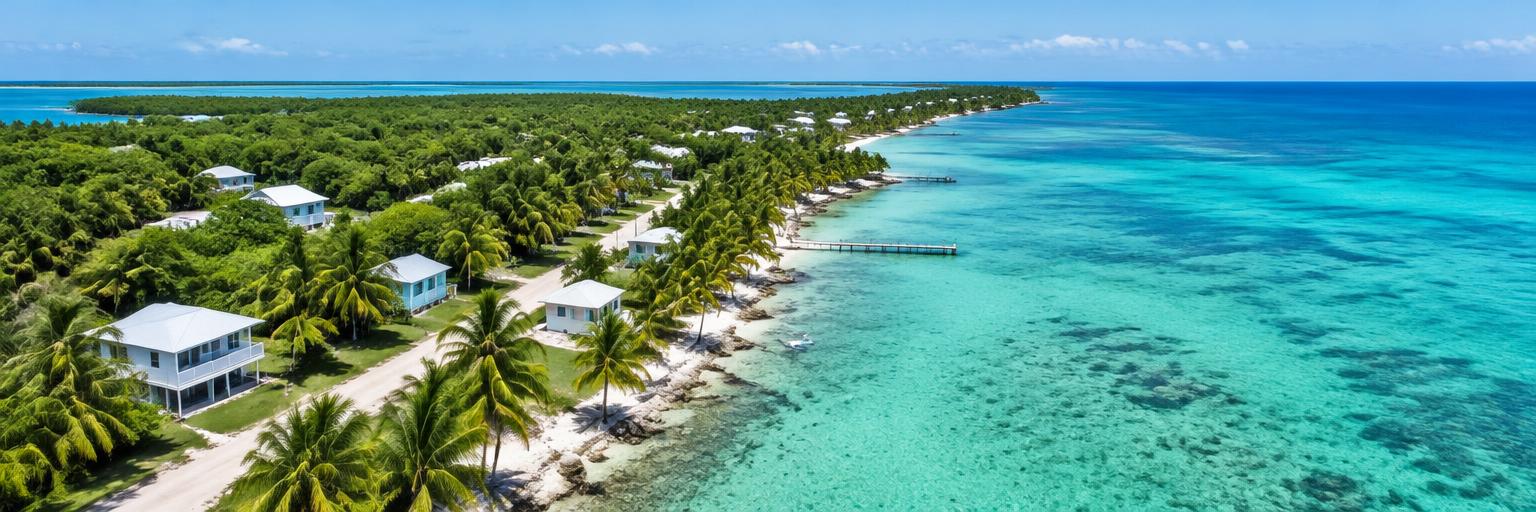
Development scenarios
Island ambition. Mainland economics. Compare the trade-offs.
Total project cost
$1,573,135
Includes construction interest
Equity required
$682,681
60% loan-to-cost · before interest
Yield on cost
4.5%
11% borrowing rate
Year 3 debt coverage
0.67×
1.25× screening benchmark
Break-even occupancy
69.3%
41.3% reported market average
Equity IRR
-15.1%
10-year operating hold · sale included
Negative leverage: borrowing costs more than the property earns.
Break-even occupancy is 69.3%, versus the reported 41.3% Caye Caulker proxy. These are reconstructed results, not the original workbook’s outputs.
Operating cash flow
Annual rental income, expenses and debt service · USD
Rental revenueOperating costsDebt service
Development budget
Land & stamp duty$84,520
Hard construction$891,000
Site & infrastructure$160,000
Soft costs & contingency$240,570
Furnishing$108,000
Construction interest estimate$89,045
Total project cost$1,573,135
Year 1 operating statement
Gross rental revenue$149,650
Variable costs & business tax$47,514
Fixed costs, insurance & reserve$31,365
Net operating income$70,771
Annual debt service$110,294
Cash flow after debt-$39,523
Personal-use opportunity cost: $37,367 / year
| Year | NOI | Debt service | Cash flow | Loan balance | Net sale proceeds |
|---|---|---|---|---|---|
| 1 | $70,771 | $110,294 | -$39,523 | $877,468 | — |
| 2 | $72,187 | $110,294 | -$38,107 | $862,980 | — |
| 3 | $73,630 | $110,294 | -$36,664 | $846,815 | — |
| 4 | $75,103 | $110,294 | -$35,191 | $828,779 | — |
| 5 | $76,605 | $110,294 | -$33,689 | $808,656 | — |
| 6 | $78,137 | $110,294 | -$32,157 | $786,205 | — |
| 7 | $79,700 | $110,294 | -$30,594 | $761,156 | — |
| 8 | $81,294 | $110,294 | -$29,000 | $733,208 | — |
| 9 | $82,920 | $110,294 | -$27,374 | $702,025 | — |
| 10 | $84,578 | $110,294 | -$25,716 | $667,235 | $296,955 |